Underground Storage Tank Identification
Underground Storage Tank Identification
Purpose
Olson Engineering Inc. conducted an environmental geophysical investigation beneath a parking lot located in downtown Denver.
Objective
The objective of the investigation was to identify and locate possible Underground Storage Tanks (UST).
Method
The objective was met using a Magnetometry (MAG) geophysical survey.
Data Acquisition
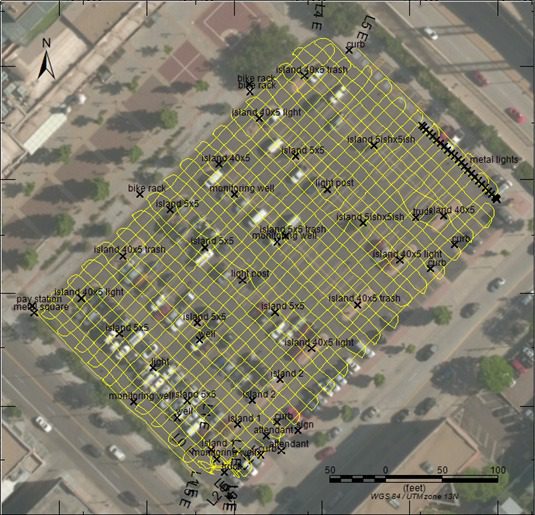
A two-man magnetometry crew completed the field work in one day. The geophysical investigation consisted of MAG transects in the area of investigation, covering an area of approximately 2.15 acres. Transects were collected with a nominal 10 foot line-spacing in both NW-SE and NE-SW directions. The positioning of the MAG instrumentation readings was continuously measured during the survey with a GPS unit capable of sub-foot horizontal spatial precision.
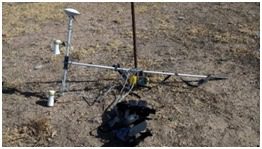
Magnetometry data were collected with a magnetometer system configured in a vertical gradient setup with two independent magnetic sensors, one above the other, using a 0.75-meter separation. MAG data were recorded at a rate of 10 Hz, with GPS embedded into the data stream at a rate of 1 Hz to ensure precise data positioning. Each MAG sensor measures the strength of the Earth’s magnetic field, called the Total Field Intensity (TFI), simultaneously. The Vertical Gradient (VG) of the magnetic field is the difference between the magnetic field values measured by the two independent sensors.
The presence of ferrous materials generates distortions in the magnetic field that are detected by each of the MAG sensors. Magnetic surveys only detect the presence of ferrous metallic objects, and the MAG method is more sensitive to metallic objects located on the surface (e.g., manhole covers, buildings, cars, etc.).
Interpretation
The raw MAG data were converted to tabular data files, then processed and gridded using geophysics software. There are three primary steps required for MAG data processing. The first step is to remove data dropouts that may have occurred during data acquisition. These data dropouts can occur when the magnetometers are aligned at a particular angle with respect to the Earth’s magnetic field, or are very close to a large metal object. These occurrences are typically less than one second in duration, and can be easily removed from the data with no detrimental effects on the final results. After removal of data dropouts, data were corrected for instrument latency by applying a small time lag to the sensor data. The TFI data from both the top and bottom sensors were examined along with the VG. Additionally, the Analytic Signal (AS) (i.e., a gradient computation which effectively compensates for the positive/negative magnetic dipole effects in order to place the magnetic anomalies over their causative bodies) of the sensors was examined. Based on the evaluation of the magnetic data, the bottom sensor Total Field Intensity and its associated Analytic Signal yield the best results for display purposes.
Results
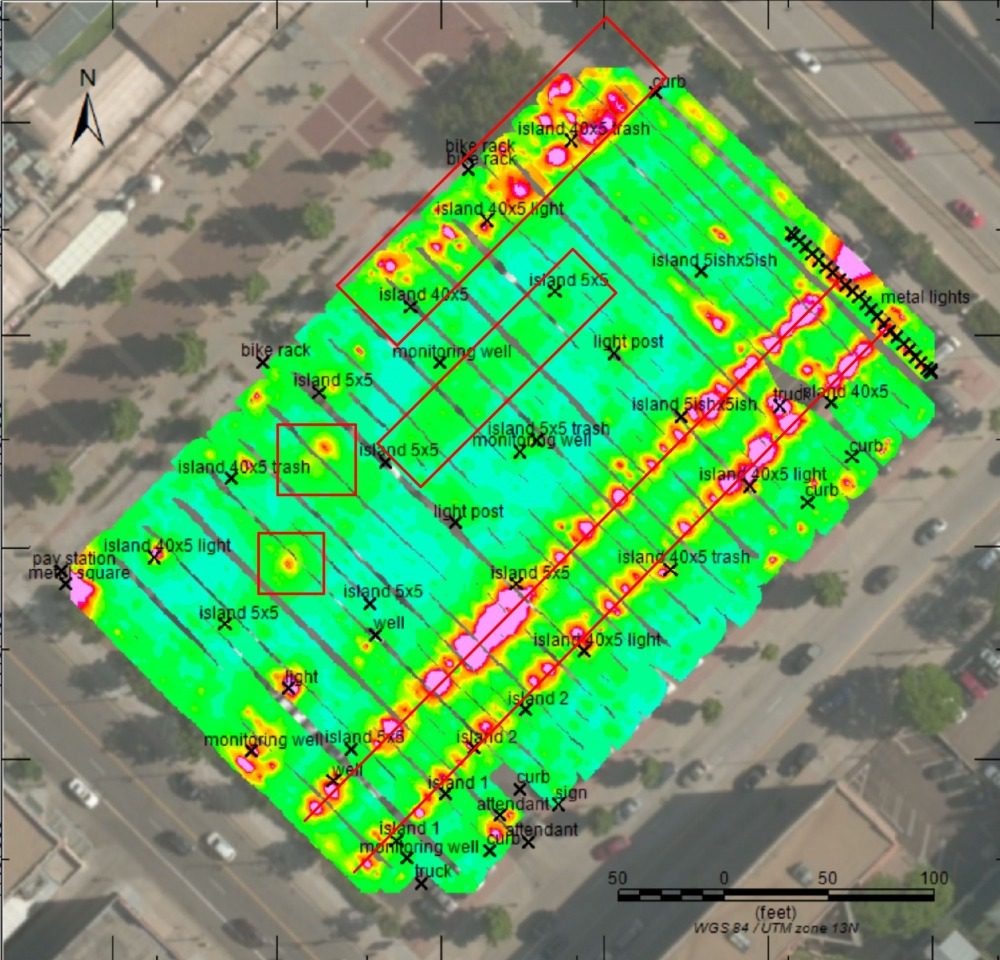
The geophysical results from the magnetic survey were presented as plan view maps as shown below, representing Total Field Intensity and Analytic Signal as color grids with ‘cool’ colors (e.g., blue and green) representing low TFI values associated with background-level measurements and ‘warm’ colors (e.g., red) representing high TFI values associated with the presence of ferrous materials. Cultural features identified on the surface during data acquisition are referred to as on-site observable/cultural features (specifically metallic items) and are displayed as black symbols in the results.
Various high amplitude and dipole anomalies were identified in the north and west portions of the survey area; these areas are highlighted by red polygons. No anomalies that were consistent with the expected size, shape and amplitude of an Underground Storage Tank were identified in the eastern portion of the survey. Two high-amplitude linear features trending SW-NE were interpreted to be railroad tracks, and are marked with red lines.
