Primary Services
Worldwide Service
For over 35 years, we have conducted projects in all 50 states of the USA and in many countries around the world, providing superior NDT and Geophysical services for our clients.
For over 35 years, we have conducted projects in all 50 states of the USA and in many countries around the world, providing superior NDT and Geophysical services for our clients.

What Does Olson Engineering Do?
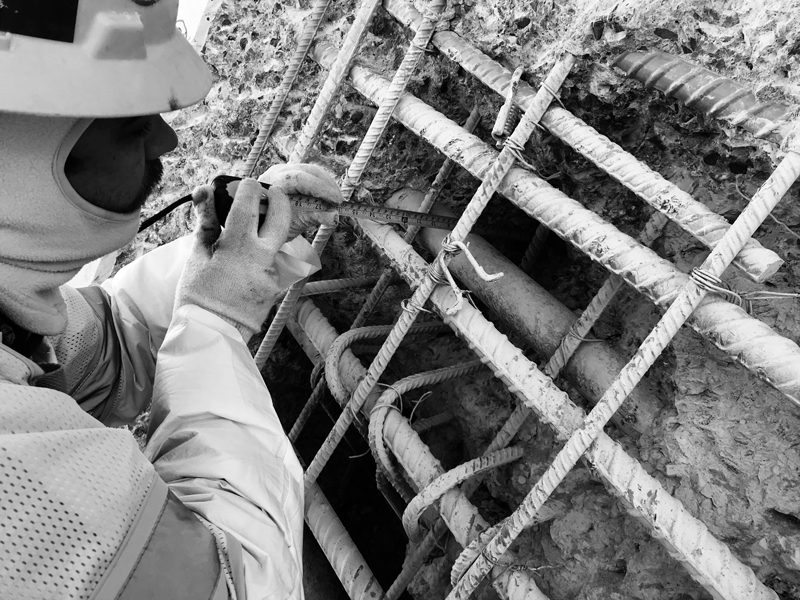
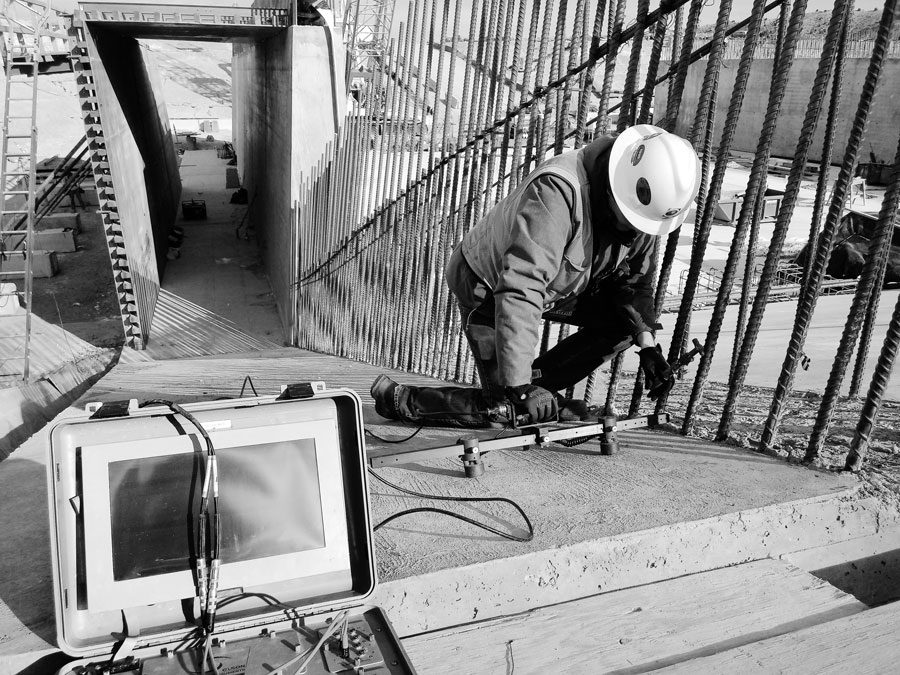
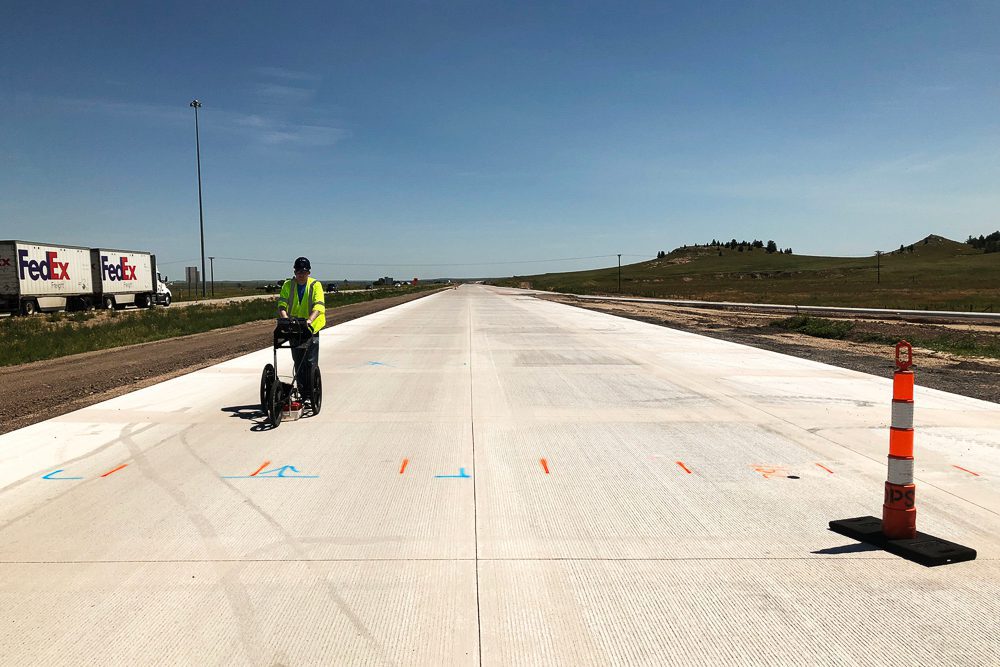
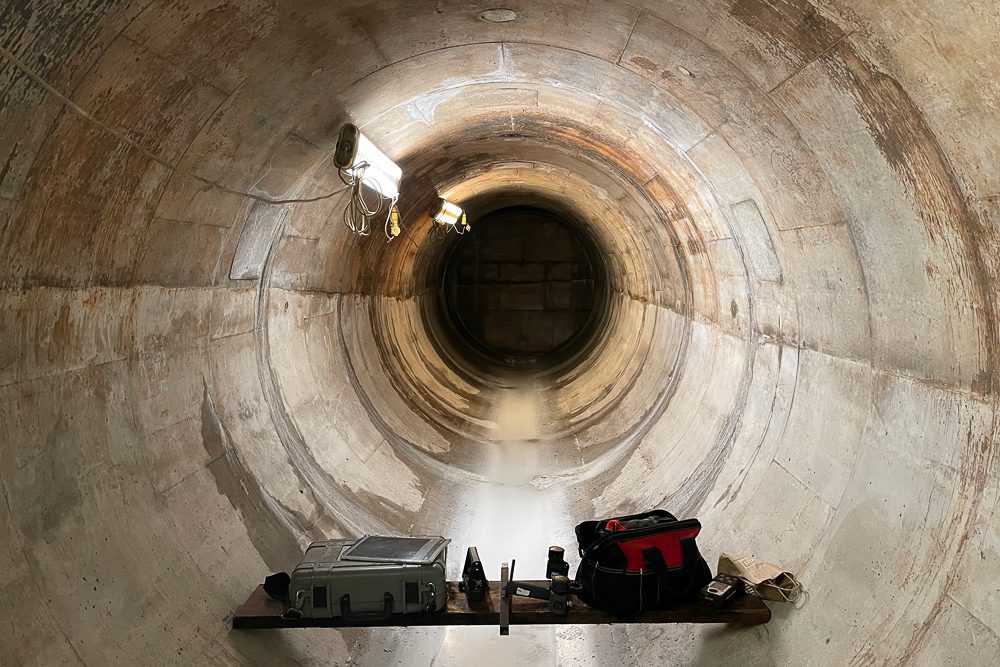
Olson Engineering provides high-quality Nondestructive Evaluation (NDE) and Geophysical imaging solutions for the purpose of minimizing risks and managing concerns in relation to man-made structures and subsurface features. We provide superior service to our clients as a single-source contractor by utilizing a unique combination of NDE technologies to determine structural health and geophysical imaging for earth material.
Methods
How we test
Client Testimonials
“We have been calling Dennis [Sack] at Olson for years whenever we have any questions about nondestructive testing and evaluation, because we know he will help us determine the best path forward for our clients – even if it does not involve services they provide! When we do need their services, for evaluating tunnel linings or bridge foundations, the work is done quickly and effectively.
Margaret A. (Peggy) Ganse, P.E., P.G.
Shannon & Wilson
“Olson consistently has been able to meet all of our urgent geophysical investigation project scheduling needs, often in a matter of days. Further, their deliverables demonstrate a strong technical quality in a concise format that helps the reader understand complicated geophysical analysis by integrating those data with our geotechnical information.”
Mark Vessely, P.E.
Shannon & Wilson
“ …Ferrovial Agroman has worked with Olson for most of its needs related to NDT and condition evaluation of bridges in North America. Ferrovial Agroman has been and is involved as contractor in many toll road projects in the USA and Canada. Many of these are expansions of existing facilities with improvement of existing non-tolled lanes and addition of additional toll lanes, such as the three projects in the DFW area: NTE, LBJ and NTE 35W, with a combined construction cost in excess of $4.5 billion. Because these projects are built over and as expansion of an existing facility, there has always been some need to, besides load-rating, evaluate in-depth the structural and durability condition of existing structures which were widened instead of replaced. In all of these projects Ferrovial Agroman has collaborated with Olson, as one of the foremost players in the field."
Fidel Sáenz de Ormijana
Ferrovial Agroman


