Wind Farm Investigation
PURPOSE
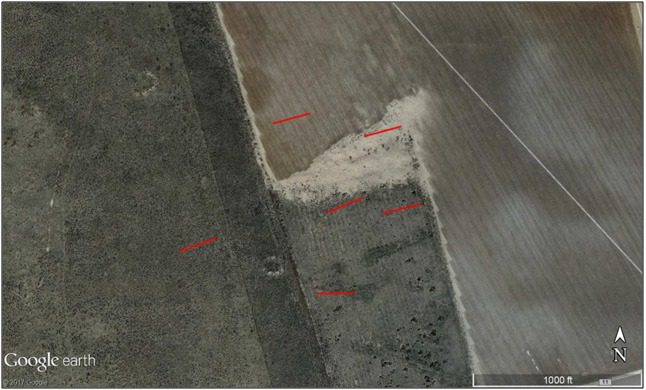
Olson Engineering conducted an engineering geophysics investigation in Texas to generate a model of shear (S-) and compression (P-) wave profiles beneath six proposed boring locations.
OBJECTIVE
Provide information necessary to confirm suitable subsurface conditions to support wind turbine foundations.
METHOD
The objective was met using both active and passive Multi-Channel Analysis of Surface Waves (MASW) and Seismic Refraction Tomography (SRT).
DATA ACQUISITION
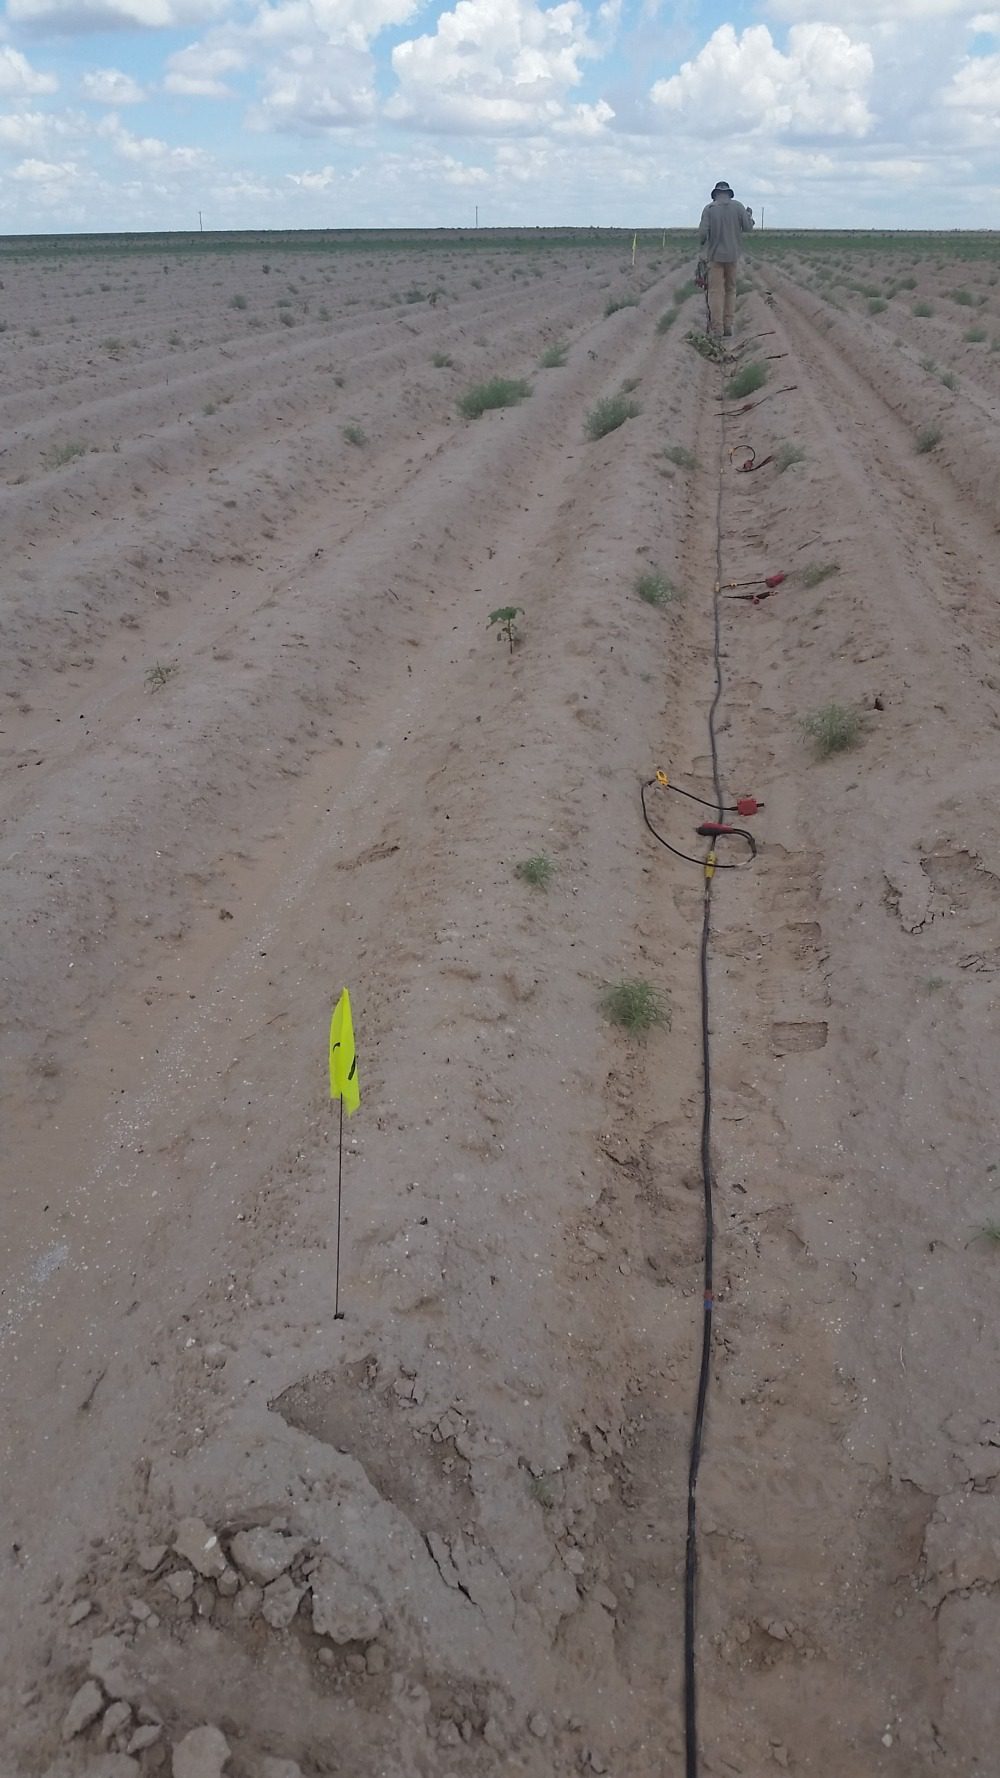
A two-man seismic crew completed the field work in one day. Data were collected using a 24-channel seismograph with twenty-four 4.5 Hz vertical component geophones placed at ten foot intervals. A single 230-foot test line was thus acquired at each proposed borehole location. Line locations and orientations were recorded by a GPS unit capable of sub-meter accuracy.
Active MASW and SRT data were acquired using an active seismic source which consisted of a sledgehammer impacting a plastic strike plate. Shot points were located every thirty feet, beginning with a thirty foot off end shot at the beginning of each line. Passive MASW data were acquired as well. There are no predefined source points for passive-source surface seismic surveys. Instead, the method uses ambient noise, or vibrational energy, that exists at a site.
INTERPRETATION
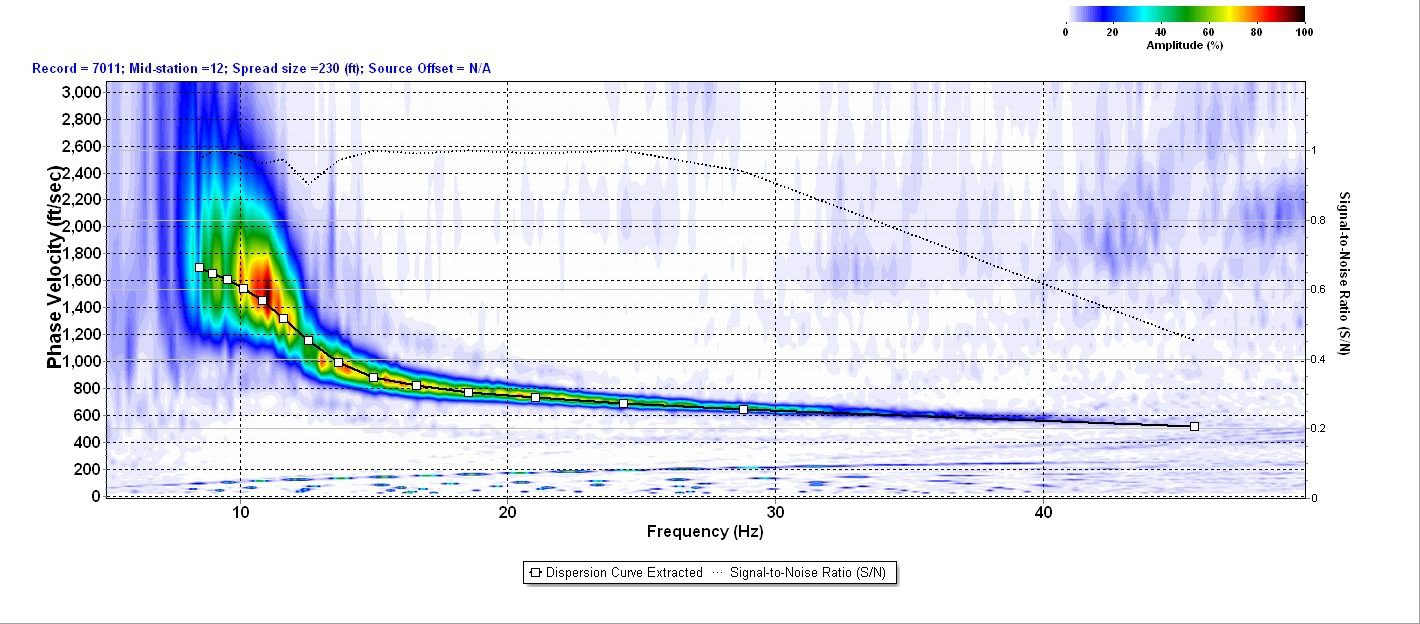
Multi-Channel Analysis of Surface Waves (MASW): Active and passive MASW analysis consists of generating a frequency-velocity transform from the surface waves, picking the transformed data to derive a dispersion curve, and inverting this dispersion curve to a layered Vs model. The figure shown here illustrates and example of the typical dispersion curve picking approach used for MASW soundings. These steps are repeated for each test line using all 24 geophone recordings at a time, resulting in a one-dimensional (1D) S-wave velocity (Vs) sounding.
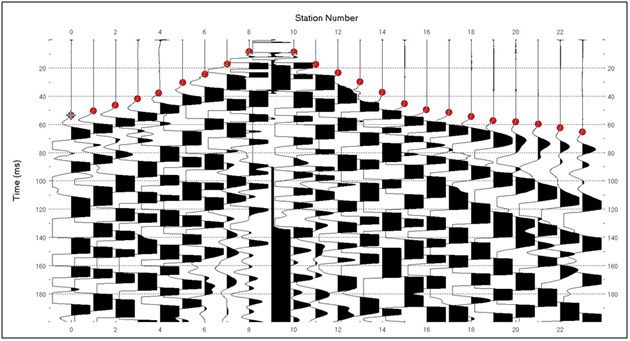
Seismic Refraction Tomography (SRT): The two major processing steps involved with SRT are first arrival picking and data inversion. The first arrival picking step consists of picking the time for each trace (signal) where the first-arrival of wave energy is observed at the geophone position. The figure shown here illustrates the typical picking approach used for SRT records. After picking is completed, a two-dimensional (2D) P-wave velocity (Vp) model is generated that best fits the first arrival picks.
RESULTS
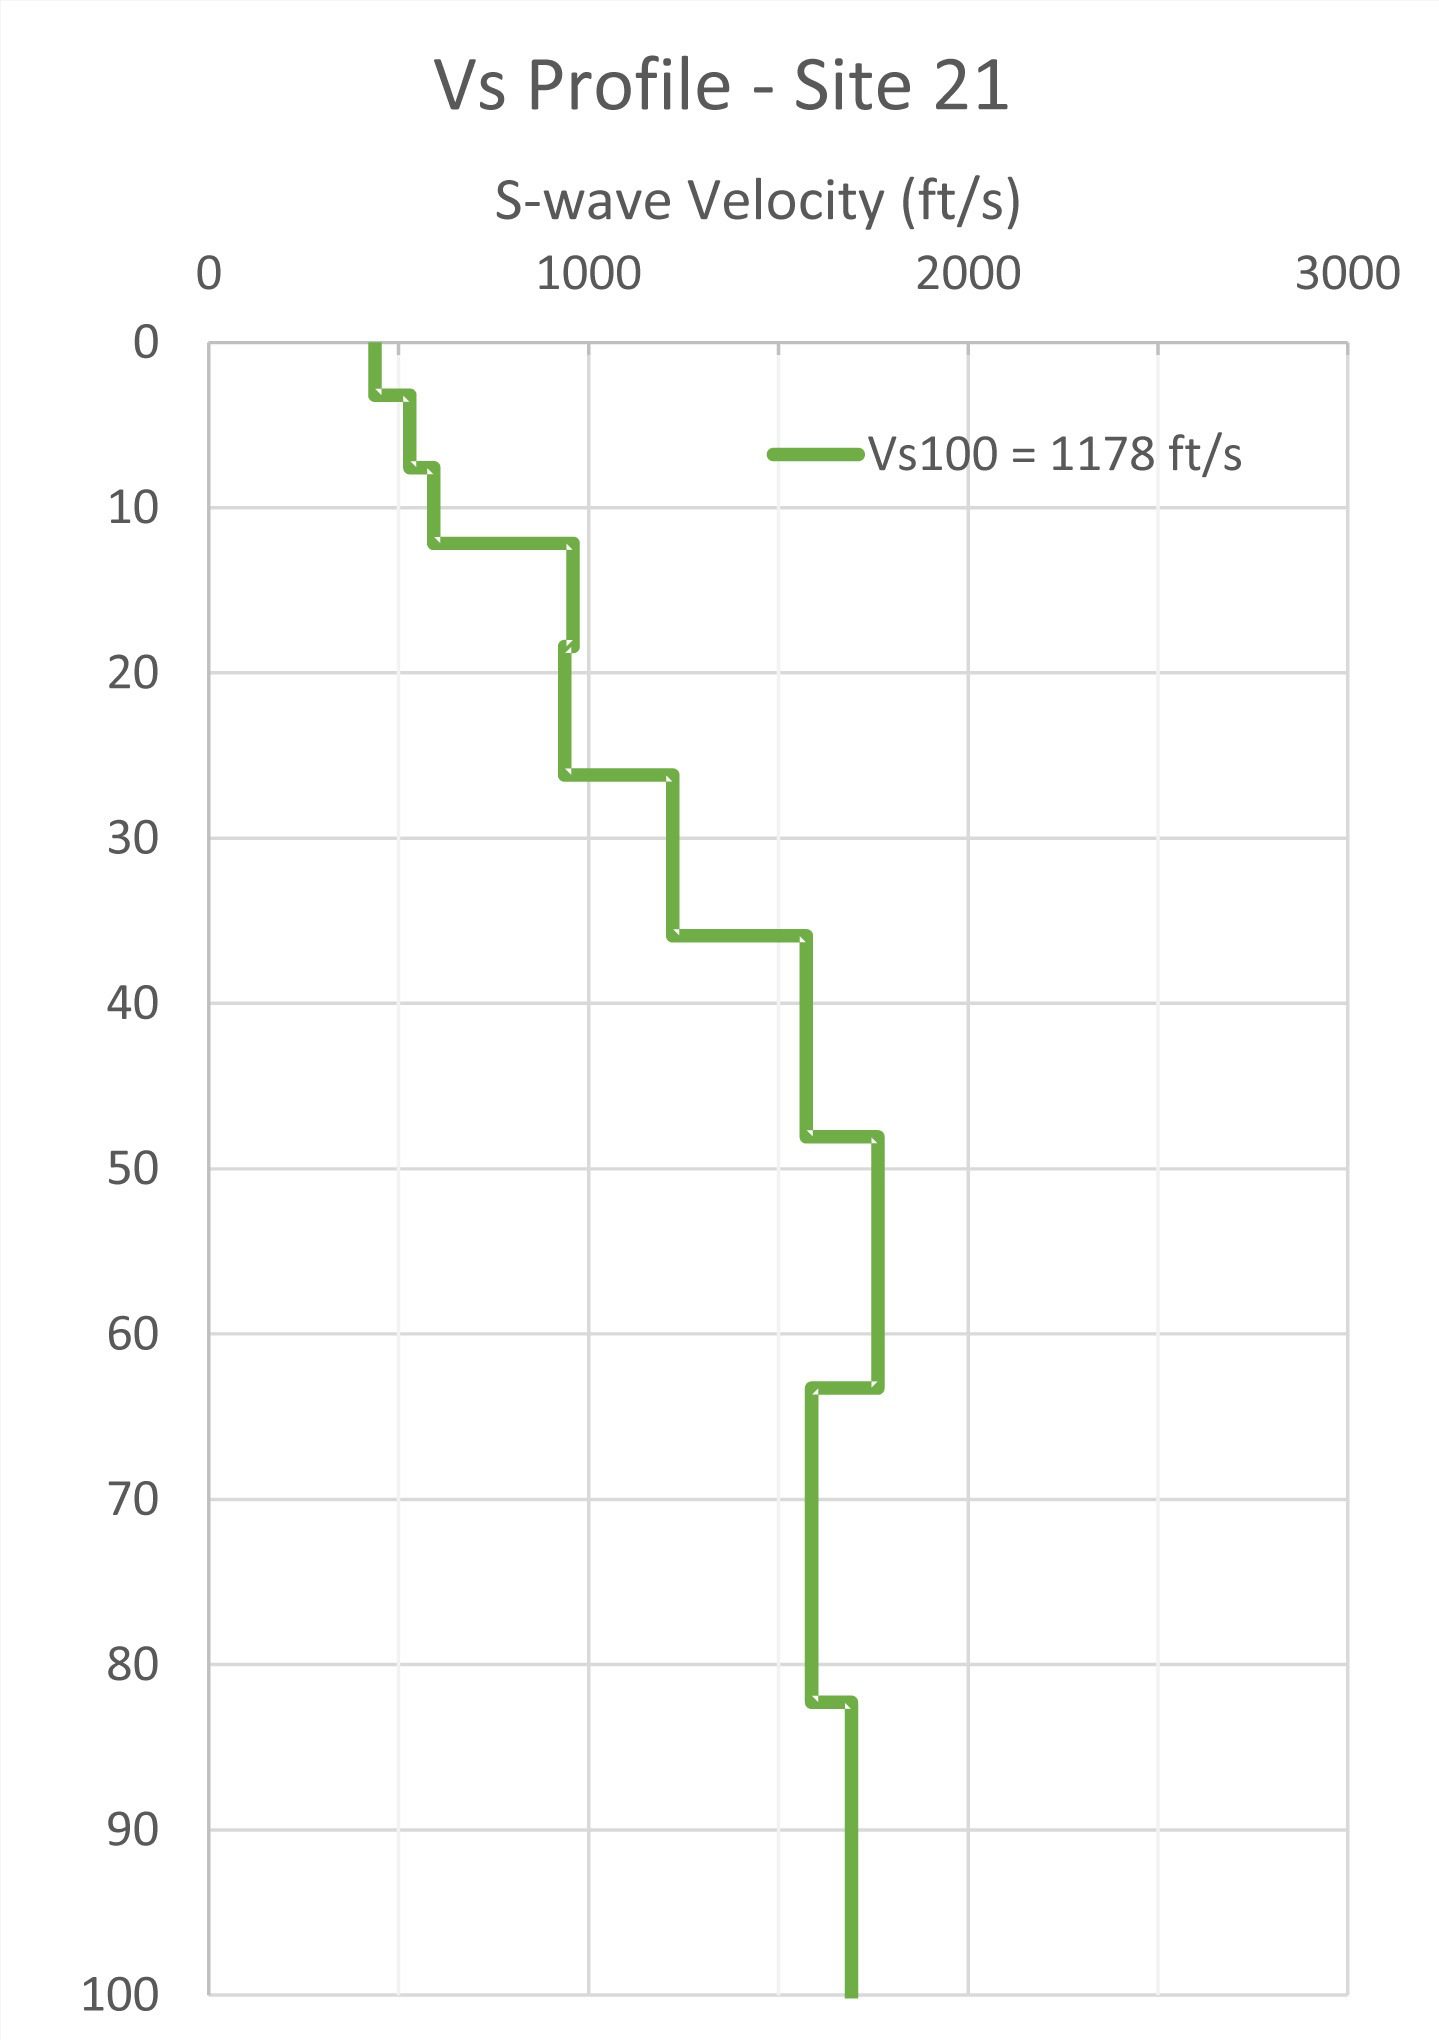
The typical 1D Vs graph displayed below represents a seismic sounding centered at the middle of each line.
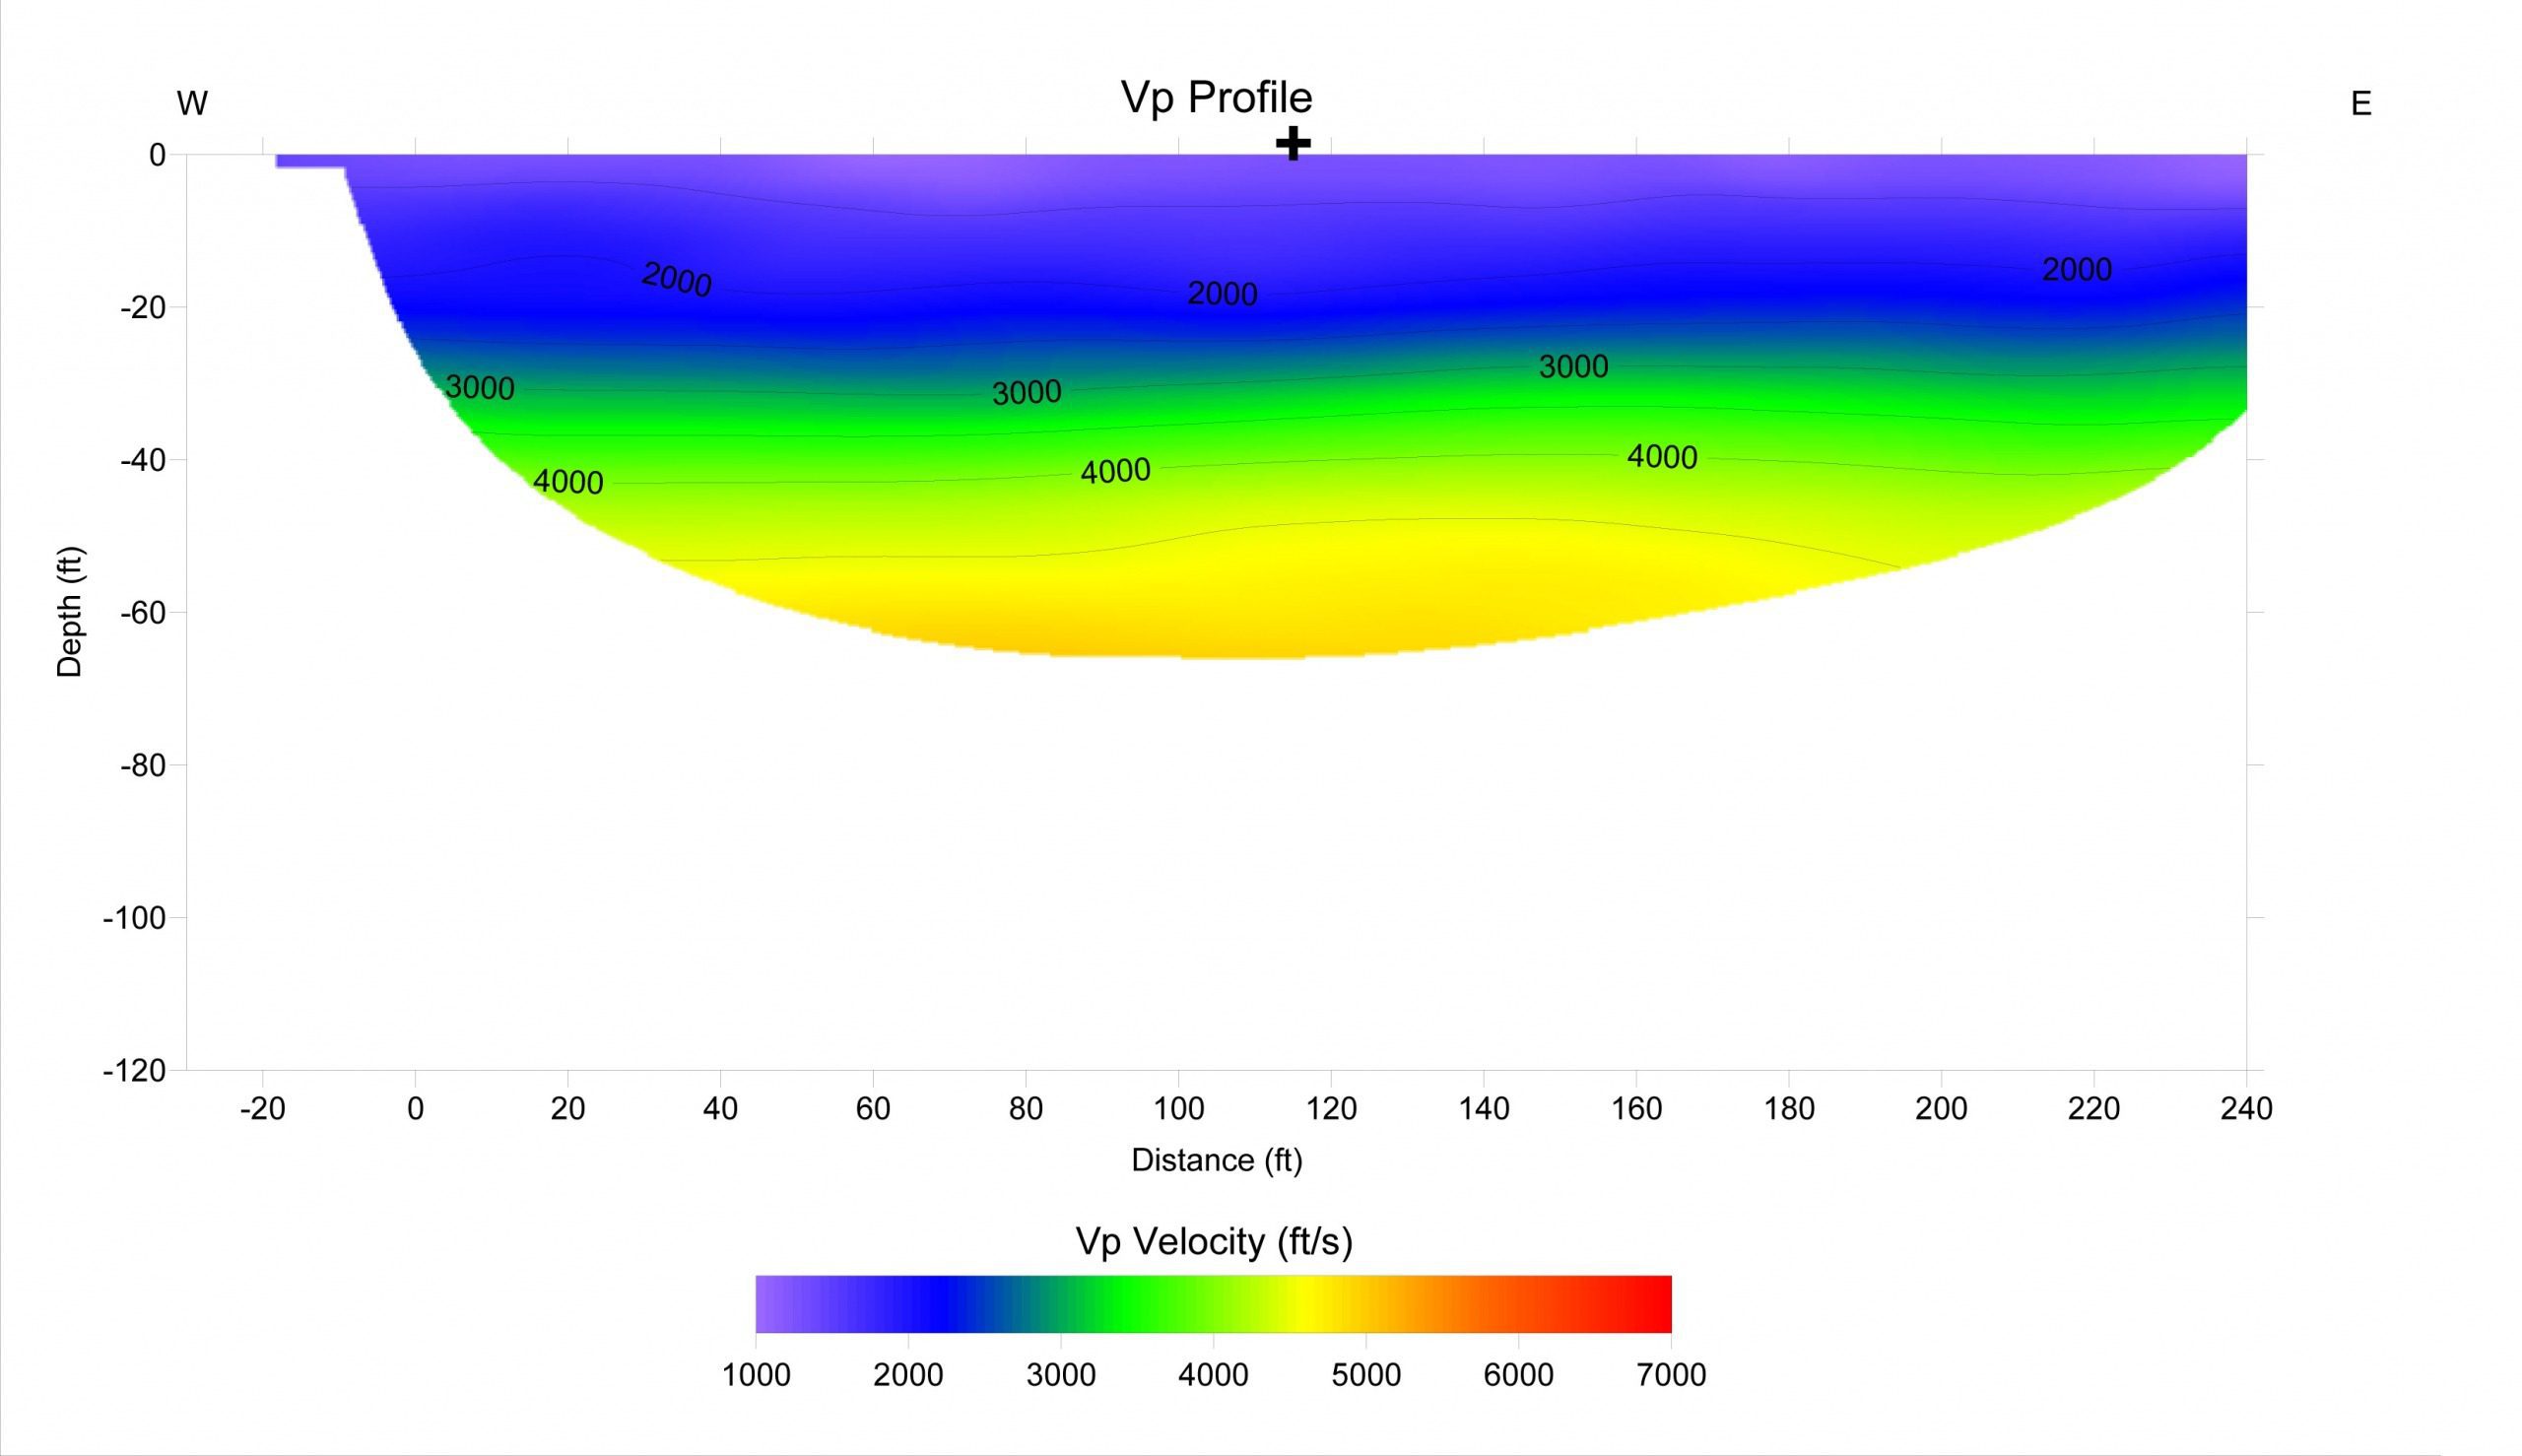
A typical 2D P-wave velocity (Vp) profile is displayed below with ‘cool’ colors (e.g., blue) representing lower velocity values associated with less dense materials and ‘warm’ colors (e.g., red) representing higher velocity values associated with more dense materials. Each of the Vp profiles are presented at the same horizontal and vertical scale (no vertical exaggeration). Annotated on the 2D Vp profiles are velocity contours and a bold cross indicating the position of the staked location in the field.
For each of the sites, seismic velocities and elastic constants with depth were generated from the Vs sounding plot and Vp profile. Correlation between P- and S-wave profiles was very good, with both models indicating a gradual increase in seismic velocities with depth, identifying the sites as good candidates for wind turbines.
